

A look at the channels your customers are on, how long they’ll wait for service on each, and their expectations when it comes to their experience between them.
“Does anyone use the phone to make phone calls anymore?”
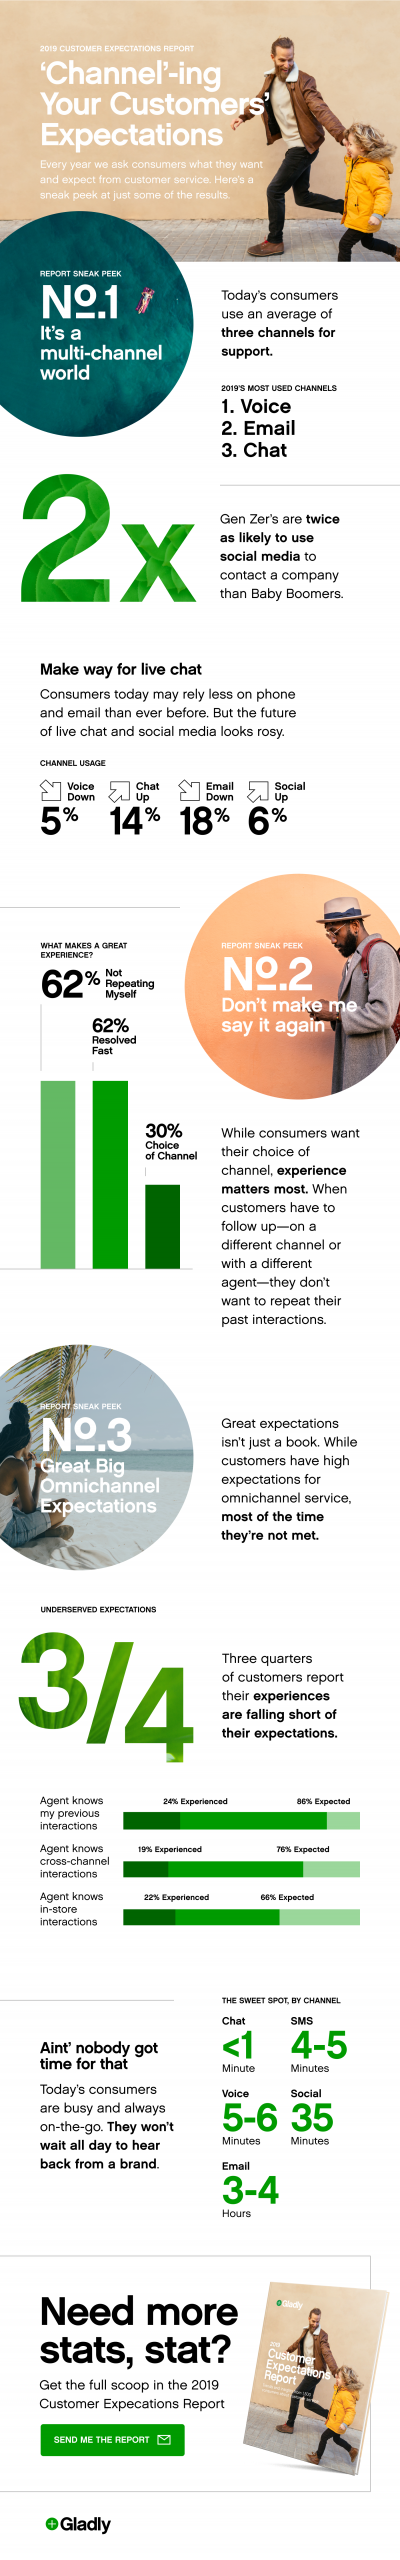
According to our 2019 Customer Expectations Report, the answer to that is a resounding yes, with almost 3 in 4 consumers reaching for their phones when looking to companies for support.
But despite the enduring popularity of the phone, overall usage of phone support has dipped 7% since 2017. Instead, consumers are generally living their best multi-channel life, using an average of 3 channels to reach out to companies.
And while companies are certainly stepping up to the plate and providing customers with their choice of channel, where they haven’t quite managed to measure up (according to consumers) is in the experience between those channels (like when a customer switches from the phone to email, or vice versa).
Check out the infographic below to see which channels are trending when it comes to customer support, how long customers will wait for service on each, and what they’re looking for when it comes to the customer experience.
 Written by: Zareen Islam
Source: Gladly
Awesome post! Keep up the great work! 🙂
Great content! Super high-quality! Keep it up! 🙂